addChart
- addBackgroundImage
- addFooter
- addHeader
- addLineNumbering
- addPageBorders
- addProperties
- addSection
- createDocx
- createCharacterStyle
- createListStyle
- createParagraphStyle
- createTableStyle
- docxSettings
- embedFont
- importHeadersAndFooters
- importListStyle
- importStyles
- modifyPageLayout
- removeFooters
- removeHeaders
- setBackgroundColor
- setDefaultFont
- setDocumentDefaultStyles
- setEncodeUTF8
- setLanguage
- setMarkAsFinal
- setRTL
- addBibliography
- addBookmark
- addBreak
- addChart
- addCitation
- addComment
- addCrossReference
- addDateAndHour
- addEndnote
- addExternalFile
- addFootnote
- addFormElement
- addHeading
- addImage
- addLink
- addList
- addMathEquation
- addMergeField
- addOLE
- addPageNumber
- addShape
- addSimpleField
- addSource
- addStructuredDocumentTag
- addSVG
- addTab
- addTable
- addTableContents
- addText
- addTextBox
- addWordML
- embedHTML
- clearBlocks
- deleteTemplateBlock
- getTemplateVariables
- getTemplateVariablesType
- modifyInputFields
- modifyMergeFields
- processTemplate
- removeTemplateVariable
- replaceListVariable
- replacePlaceholderImage
- replaceTableVariable
- replaceVariableByExternalFile
- replaceVariableByHtml
- replaceVariableByText
- replaceVariableByWordFragment
- replaceVariableByWordML
- setTemplateSymbol
- tickCheckbox
addChart
 BASIC / ADVANCED / PREMIUM
Inserts a chart into a Word document.
This method allows the insertion of a chart into your Word document.
You may insert many different type of 2D and 3D charts:
- 2D
- Bar (clustered, stacked and 100% stacked).
- Column (clustered, stacked and 100% stacked).
- Pie (simple, exploded, pie of pie and bar of pie).
- Doughnut.
- Line.
- Area.
- Surface.
- Radar.
- XY(scatter).
- Bubble.
- 3D
- Bar: box (default), cylinder, cone, and pyramid (clustered, stacked and 100% stacked).
- Column: box (default), cylinder, cone, and pyramid (clustered, stacked and 100% stacked).
- Pie (simple and exploded).
- Surface.
- Line.
This method also allows adding combo charts, trendlines, grids, labels and many other chart features.
options
| Key | Type | Description |
|---|---|---|
| dataLegends | ArrayList<String> | Legend values. |
| dataNames | ArrayList<String> | Name values. |
| dataValues | ArrayList<ArrayList<Double>> | Data values. |
| type | String | The possible values are:
|
| title | String | The chart title (if any). |
| border | Integer | Border width in points. |
| chartAlign | String | Chart alignment: left (default), right or center. |
| color | String | Word color scheme for charts:
|
| comboChart | String | Chart to add a as combo chart. Use with the returnChart option. Global styles and properties are shared with the base chart. For bar, col, line, area, and radar charts. |
| floatChart | String | Floating chart: left, right or center. It only applies if textWrap is not inline (default value). |
| font | String | The font to be used. Arial, Calibri... |
| returnChart | Boolean | False as default, if true return the XML of the chart. To be used with the comboChart option. |
| sizeX | Integer | The chart width in centimeters (default value aprox 8.5 cm). |
| sizeY | Integer | The chart height in centimeters (default value aprox 6.0 cm). |
| textWrap | Integer | The way text shoud wrap the chart. Possible values are (check in the Word interface for the graphical explanation of the different terms):
|
| trendline | ArrayList<HashMap<String, String>> | Adds trendlines. Compatible with line, bar, col and area 2D charts. Possible keys and values are:
|
Chart display properties
| Key | Type | Description |
|---|---|---|
| formatCode | String | Number format. |
| formatDataLabels | HashMap<String, String> | Possible keys and values are:
|
| haxLabel | String | Label for the horizontal axis. |
| haxLabelDisplay | String | How to display the label of the horizontal axis. Possible values are: vertical, horizontal, rotated. |
| hgrid | Integer | Horizontal grid. Possible values are:
|
| horizontalOffset | Integer | Given in emus (1cm = 360000 emus). |
| majorUnit | String | Major unit value for bar, col, line, area, radar and scatter charts. |
| minorUnit | String | Minor unit value for bar, col, line, area, radar and scatter charts. |
| scalingMax | Double | Scaling max value for bar, col, line, area, radar and scatter charts. |
| scalingMin | Double | Scaling max value for bar, col, line, area, radar and scatter charts. |
| stylesTitle | HashMap<String, String> | Possible keys and values are:
|
| vaxLabel | String | Label for the vertical axis. |
| vaxLabelDisplay | String | How to display the label of the horizontal axis. Possible values are: vertical, horizontal, rotated. |
| verticalOffset | Integer | Given in emus (1cm = 360000 emus). |
| vgrid | Integer | Vertical grid. Possible values are:
|
The available parameters to display legends and data include:
| Key | Type | Description |
|---|---|---|
| legendOverlay | Boolean | If true the legend may overlay the chart. This option may hinder the legibility of tha data so it is only recommended if it is crucial to "save space". |
| legendPos | String | The possible values are:
|
| showCategory | Boolean | If true shows the categories inside the chart. |
| showLegendKey | Boolean | If true shows the legend values. |
| showPercent | Boolean | If true shows the percentage values. |
| showSeries | Boolean | If true shows the series values. |
| showTable | Boolean | If true shows the chart data in an associated table. |
| showValue | Boolean | If true shows the chart data values. |
Further configuration options for specific chart types are:
| Key | Type | Description |
|---|---|---|
| Bar and column charts | ||
| gapWidth | Integer | Distance between the two charts. |
| groupBar | String | Different ways to group the data. Possible values are: clustered, stacked, percentStacked and standard. |
| overlap | String | Overlap. |
| tickLblPos | String | Tick label position. |
| Pie and doughnut charts | ||
| explosion | Integer | Distance among different sectors. |
| holeSize | Integer | Size of the inner hole (only doughnut charts). |
| ofPieCharts: pie of pie and bar of pie charts | ||
| custSplit | ArrayList<Integer> | Custom split. |
| gapWidth | Integer | Distance between the two charts. |
| secondPieSize | Integer | Percentage size of the auxiliary chart. |
| splitType | String | How to split the two charts. Possible values are:
|
| splitPos | Double | Determines the threshold value to split the charts. |
| subtype | String | Defines if the auxiliary chart is a pie or bar chart. Possible values are pie or bar. |
| Line and scatter (XY) charts | ||
| smooth | Boolean | If true it smooths the line (only scatter charts). |
| symbol | String | The possible symbol values are:
|
| symbolSize | Integer | The size of the symbol used. |
| Radar charts | ||
| style | String | Defines the radar chart style. Possible values are:
|
| Surface charts | ||
| wireframe | Boolean | If true the surface is shown as a wireframe. |
Additional available options for 3D charts:
| Key | Type | Description |
|---|---|---|
| perspective | Integer | Perspective angle. Angles beyond 25 degrees provoke a big distortion in the 3D chart representation. |
| rotX | Integer | Rotation angle respect the vertical axis. Standard values are between 10 and 20 degrees. |
| rotY | Integer | Rotation angle respect the horizontal axis. Standard values are between 10 and 20 degrees. |
String. To be used as combo chart.
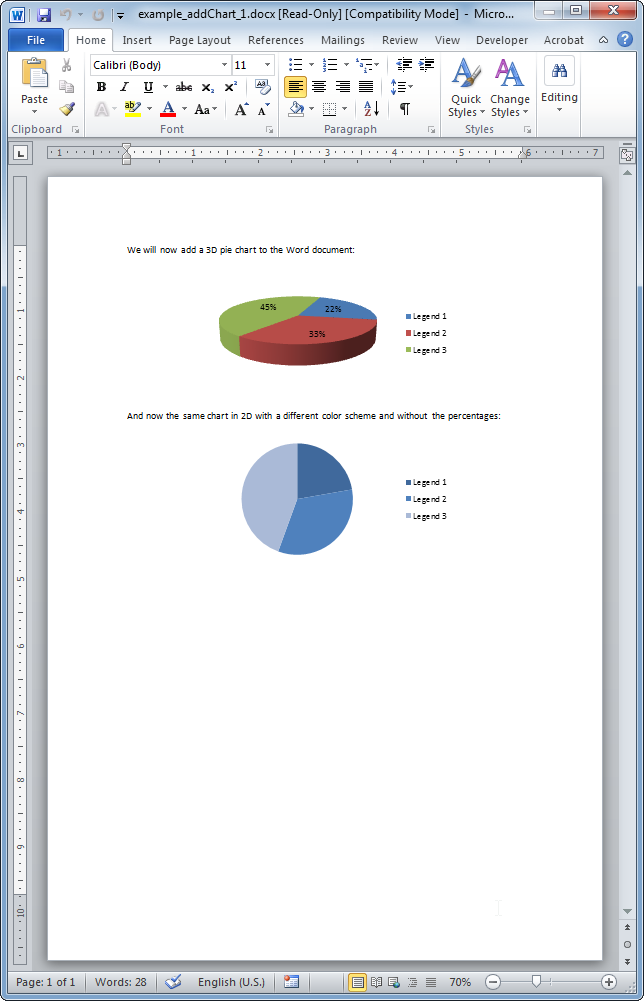
Example #1
The resulting Word document looks like:
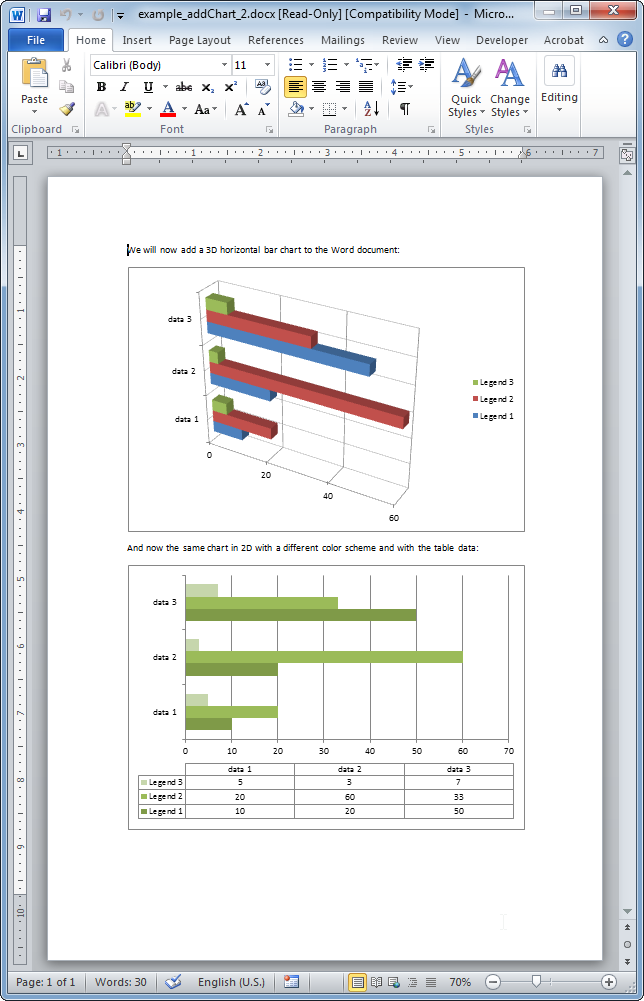
Example #2
The resulting Word document looks like:
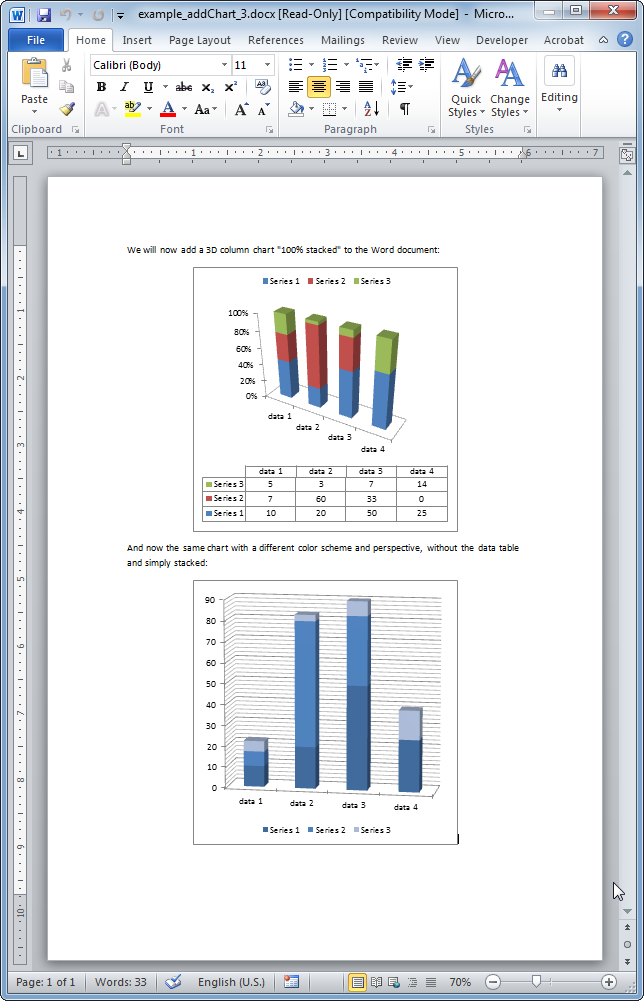
Example #3
The resulting Word document looks like: